Reading the forest plot
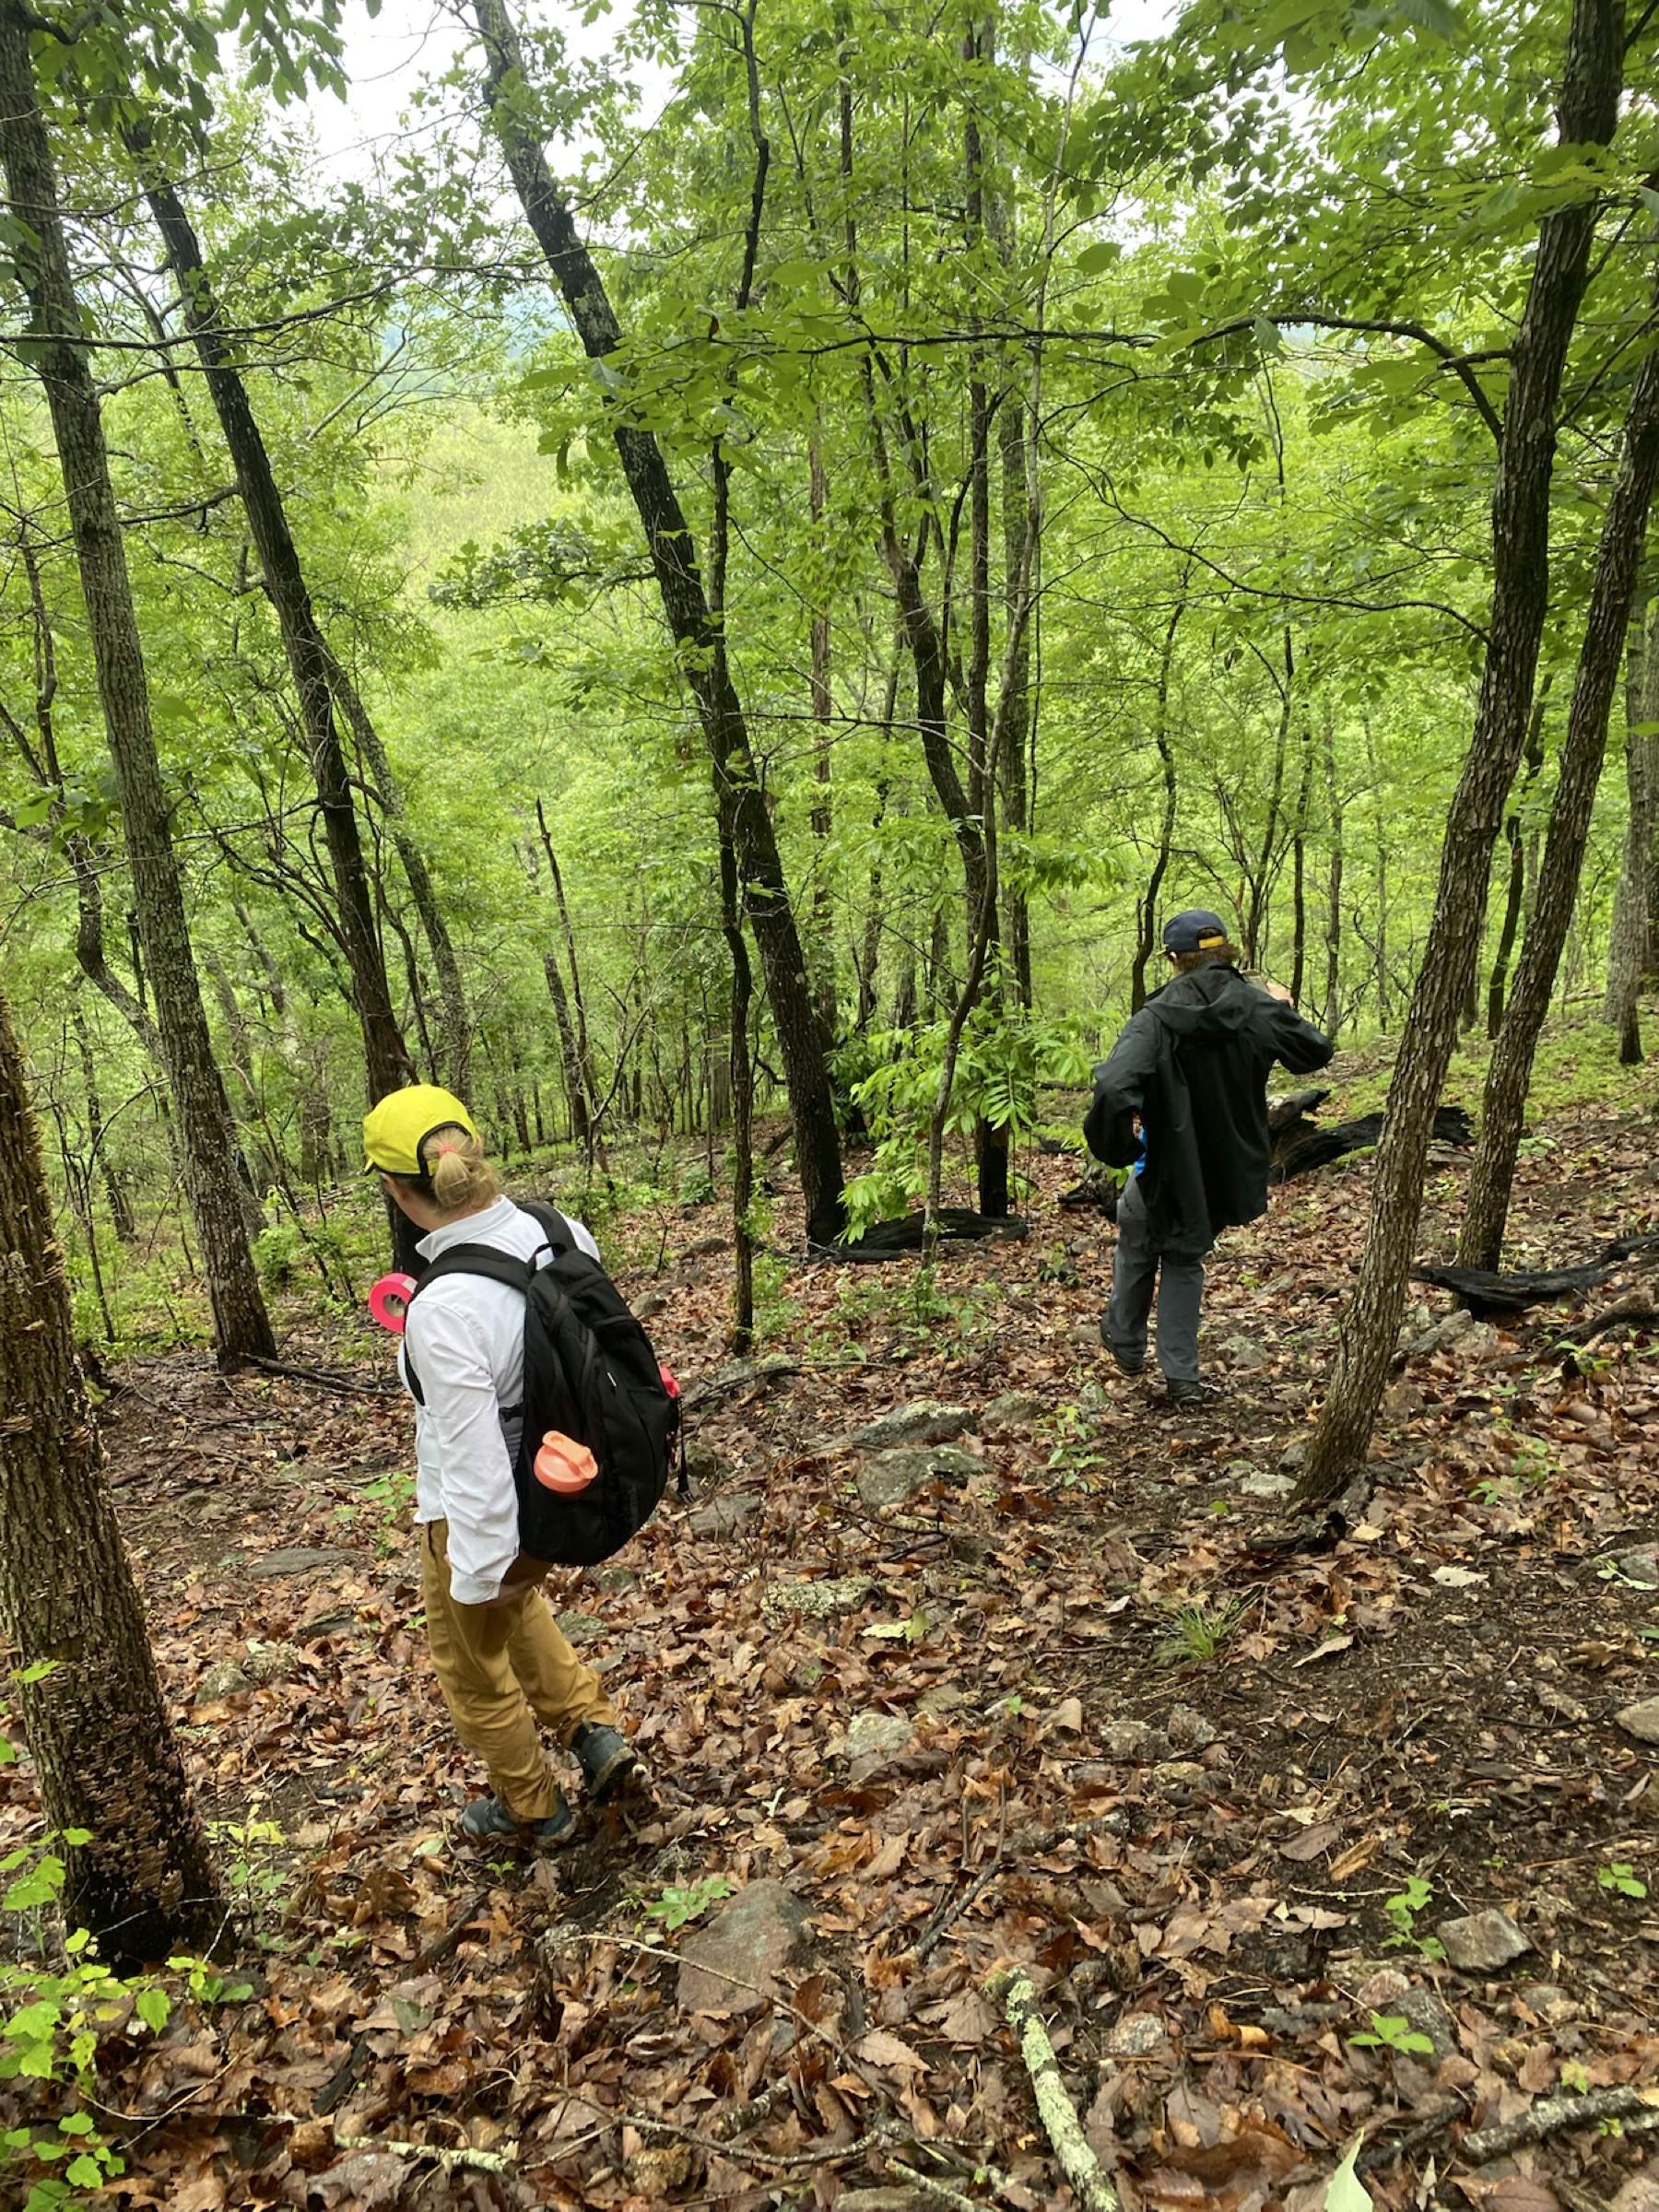
Forest carbon sampling starts with careful observation. Before the numbers mean anything, the site has to be described clearly: what the canopy looks like, how dense the understory is, what the soil surface contains, and how the plot conditions might affect the sample. In forest ecology work, these details help connect raw measurements to the real landscape they came from.
Repeatable Methods, Reliable Data
The work is repetitive by design. Vegetation structure, soil material, organic matter, and site notes all have to be collected through the same method each time. That consistency is what makes field data useful. A single sample can describe one point in the forest, but repeated measurements across plots begin to show patterns in carbon storage, plant cover, and ecosystem condition. These patterns can inform us on how forests respond to management, disturbance, fire history, climate stress, and site conditions.
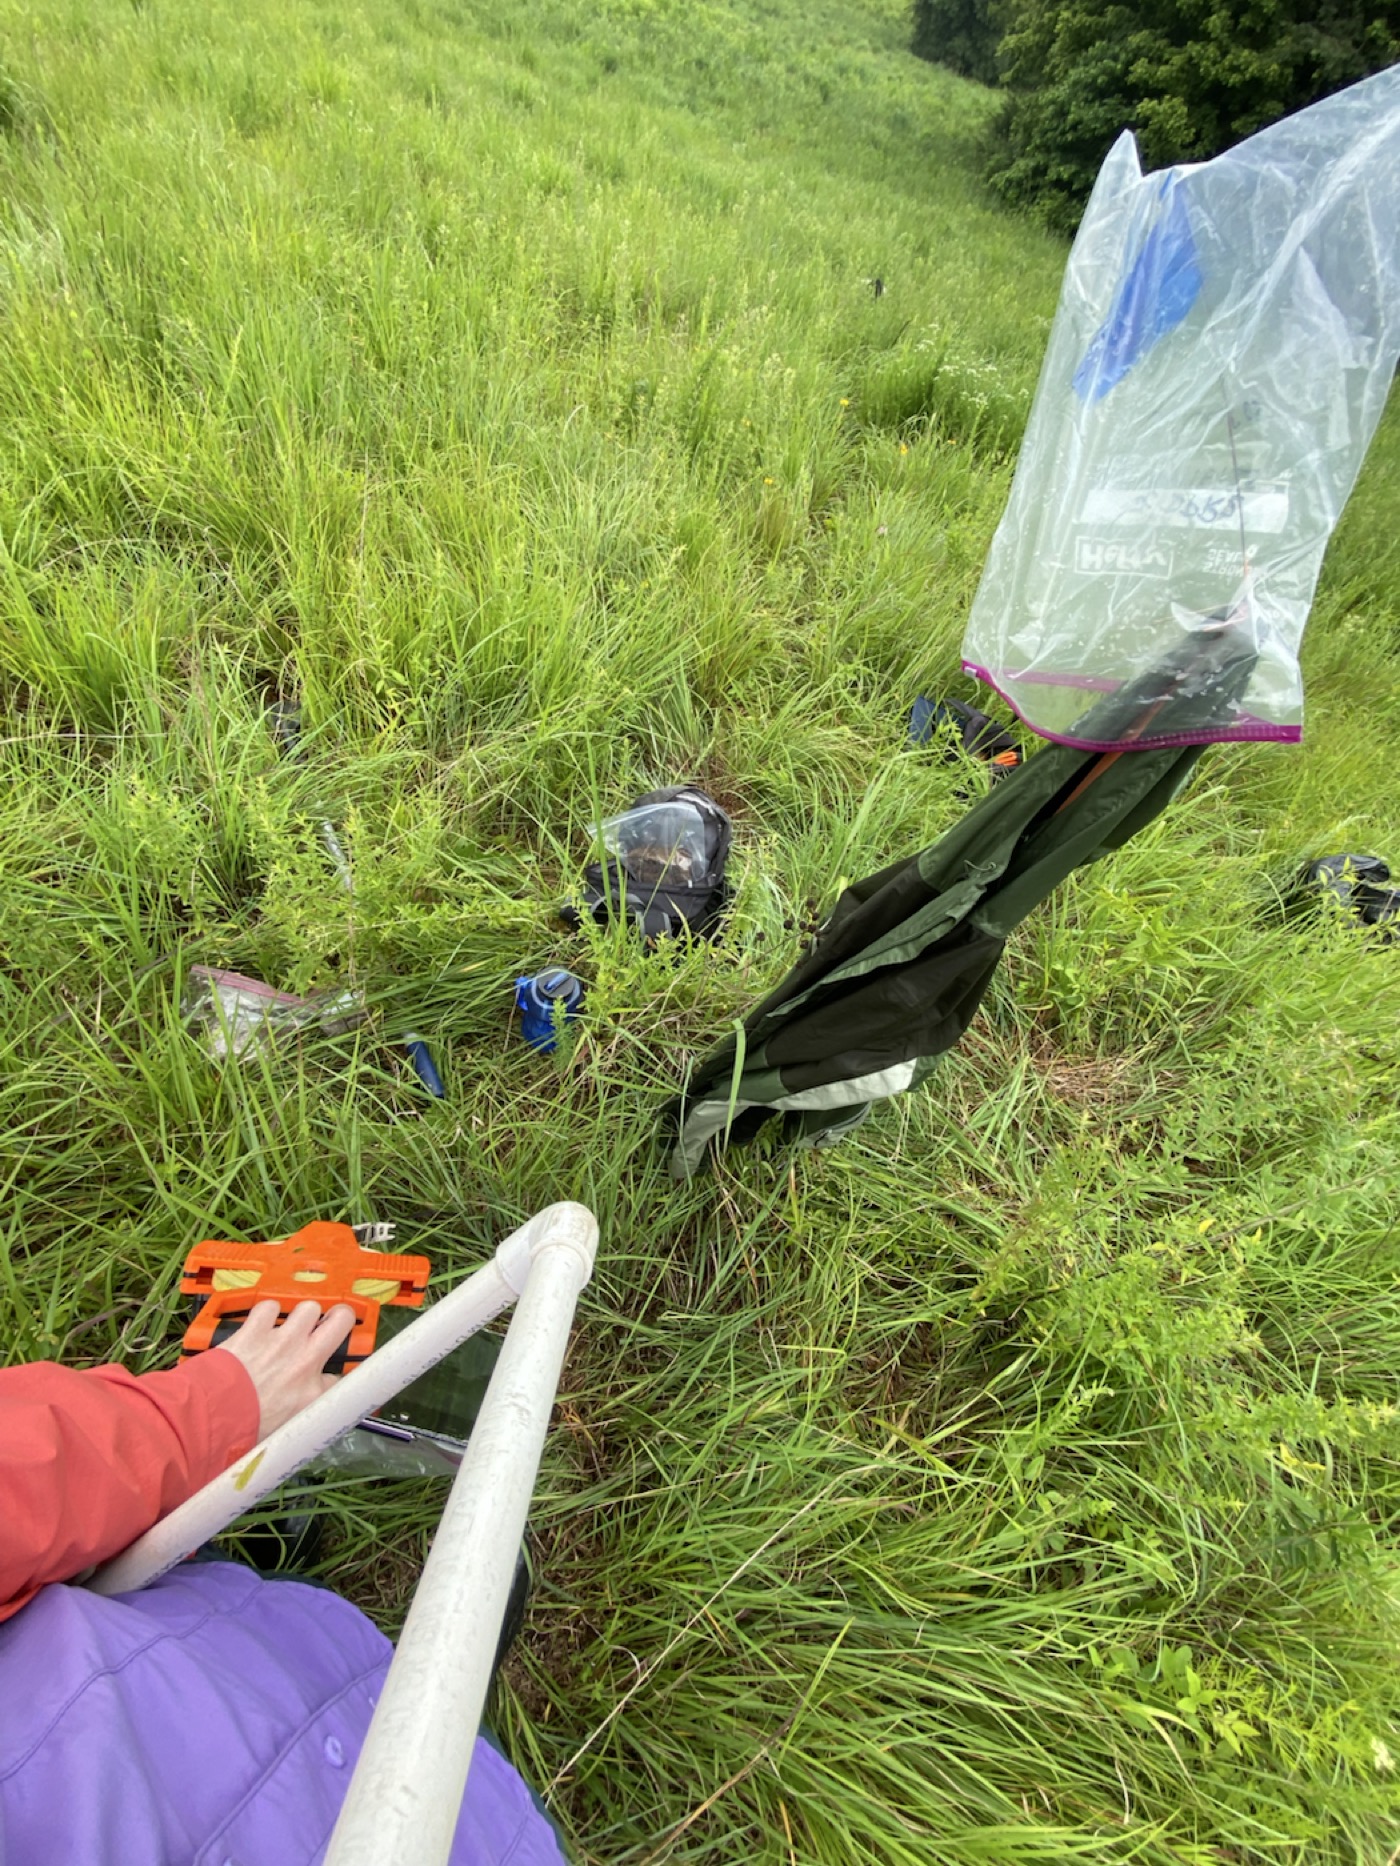
From Field Samples to Lab Records
In the Forest and Fire Ecology Lab, this kind of work included collecting visual forest trait data such as understory, midstory, and overstory cover, percent of crown dieback, and mortality, as well as sampling carbon pool measurements in soils and understory vegetation, and processing soil and organic samples in the lab. The field portion depends on accuracy, but the lab and data stages depend on traceability: knowing where each sample came from, how it was handled, and what it represents.